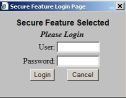
Information on roadway lighting is available, to include Arm Type,
Bulb Type, Bulb Watt and Pole Type. This is secure information and a username and password are required to
view this data (see your supervisor if required); the Login dialog shown below will appear when selecting the
"Lighting" Query.
The Lighting Control Panel is shown below.
Lighting: An explanation of the Control Panel terminology and an example search is shown below the following images:
 |
- Video Cam Icon: Click this Icon next to the Lighting heading to view a short video describing
available features in the Lighting queries.
- Output LRM: Select the desired LRM to display from the picklist:
- Category: Select the category to perform the search on.
- Selected Route: All state routes and major county routes (functionally classed minor collector and above) are listed in the drop down box, and any single route may be selected for the map/report. If a particular route is selected, a box will appear for the input of the beginning (BMP) and ending milepoints (EMP) for the map/report.
- Spatial Filter: This filter defines a particular area for building the map/report. Current
View will make the map/report using whichever map may be currently visible at the right of the Control Panel;
additional filters include maps of Island, Census Tracts, political House & Senate districts (state),
and a Custom filter, enabling the drawing of a circle or polygon around a desired area for the map/report.
Selection of the Spatial Filter option will produce an Area drop-down box which contains available Island
names, district numbers, etc. depending upon the filter that was selected.
Using the Custom Filter: to map features within a selected circular or polygon area in the map, select
"Custom Filter", click the radio button for Circle or Polygon, and then click the "Draw Filter" button.
A dialog box instructs to draw a circle\polygon and then make a map. Click "ok" and the cursor will appear
as a "+".
-To draw a circle, click once on the map where the center of the circle will be and release the mouse
button; then move the mouse to move the cursor away from that point to the desired radius of the circle
and click again; the cursor will then be free to select Make Map, etc.
-To draw a polygon, click once on the map, release the mouse button, and move the mouse to draw the
first leg of the polygon; click once, then draw the next leg; repeat drawing as many legs as desired, then
double click to finish the polygon and free the cursor to select Make Map, etc.
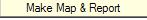
- Make Map:
To make a map of the lighting on a selected route, select a route from the "Selected Route" drop down
and then enter the criteria in the Attribute fields which will then appear as shown in the following
view; Click Make Map and the resulting map is shown on the right. Moving the cursor over the map features
provides a tool tip with information on the lighting. The Legend can be minimized by clicking the "Click
to Hide" line at the bottom of the Legend.
Note that if the results are to be saved as a DGN, Shape or KML file, the check box
at the bottom of the Control Panel labeled "Save Results As" must be checked before making a map.
Once the map is presented, information may be viewed in the tool
tips when the mouse is moved over the Lighting Symbol as shown on the map above right.
- Make Map & Build Report: A comprehensive report of available data for the selected features
can be created with the map by selecting this function.
By clicking on the link "Report>>" above the Map area as shown in view below at the left, the Report -
along with a small view of the map - becomes visible; clicking the "<<Map" link above the report
returns the map. By clicking on an active button (i.e., not muted) at the left of the report, a Map of
only the selected Light will be returned.
- Backdrop: Before making a map, selecting Raster will display a low-resolution satellite image under the resulting map. Selecting Vector returns the map to the normal view.
- Save Results As: Before making a map, checking this box will provide a zipped file for download that contains
Shape (shp) files, Design (DGN) files or Google Earth (KML) files.
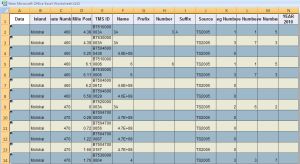
Outputting Reports
Reports can be copied and saved into any Microsoft-compatible desktop office product. This example
uses a Microsoft Excel worksheet. All of the standard manipulations may be performed on the report
(sorting, totals, saved, printed, etc.). The following views show the Report with cells highlighted
for copy (right-click and copy), and the Excel data sheet into which the cells have been pasted (
right-click & paste).
Report:
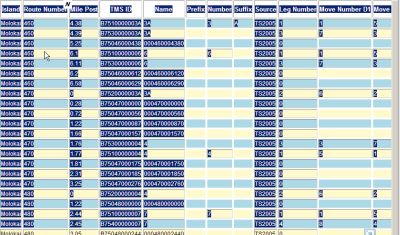
Excel data sheet: