A wealth of information is available in maps and reports through the various criteria contained in
the Control Panel selections described below. These criteria can be mixed & matched in ways to meet the needs of
the user.
Road Inventory: An explanation of the Control Panel terminology and an example search is shown below the following images:
 |
- Video Cam Icon: Click this Icon next to the Road Inventory heading to view a short video describing
available features in the Road Inventory queries.
- Output LRM: Select the desired LRM to display from the picklist:
- Category: The categories are data items gathered from the Straight Line Diagrams and photologs.
These data items include Mileposts, Road Diagram Features, Road Names, Access Control, Call Boxes,
Development Areas, DOD Sections, Guard Rails, Jurisdictions, Lane Count, Median Types and Widths,
Shoulder Types and Widths, Sidewalks, Terrain, Lane Types and Widths
- Selected Route: All state routes and major county routes (functionally classed minor collector and above) are listed in the drop down box, and any single route may be selected for the map/report. If a particular route is selected, a box will appear for the input of the beginning (BMP) and ending milepoints (EMP) for the map/report.
- Spatial Filter: This filter defines a particular area for building the map/report. Current
View will make the map/report using whichever map may be currently visible at the right of the Control Panel;
additional filters include maps of Island, Census Tracts, political House & Senate districts (state),
and a Custom filter, enabling the drawing of a circle or polygon around a desired area for the map/report.
Selection of the Spatial Filter option will produce an Area drop-down box which contains available Island
names, district numbers, etc. depending upon the filter that was selected.
Using the Custom Filter: to map features within a selected circular or polygon area in the map, select
"Custom Filter", click the radio button for Circle or Polygon, and then click the "Draw Filter" button.
A dialog box instructs to draw a circle\polygon and then make a map. Click "ok" and the cursor will appear
as a "+".
-To draw a circle, click once on the map where the center of the circle will be and release the mouse
button; then move the mouse to move the cursor away from that point to the desired radius of the circle
and click again; the cursor will then be free to select Make Map, etc.
-To draw a polygon, click once on the map, release the mouse button, and move the mouse to draw the
first leg of the polygon; click once, then draw the next leg; repeat drawing as many legs as desired, then
double click to finish the polygon and free the cursor to select Make Map, etc.
- Year: Select the year on which to query.
- Make Map: After the preceding criteria have been selected (or using the default selections) a
color-coded map of the features will be produced when the Make Map button is selected. Note that if the
results are to be saved as a DGN, Shape or KML file, the check box at the bottom of the Control labeled
"Save Results As" must be checked before making a map.

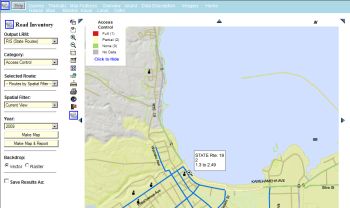
Once the map is presented, detailed information may be viewed in the tool
tips when the mouse is moved over the data items on the map as the following map of category "Access
Control" in the Hilo area shows.
- Make Map & Build Report: A comprehensive report of available data for the selected features can be created with the map by selecting this function; see the “Road Inventory Query Example” below for more information on Reports.

- Backdrop: Before making a map, selecting Raster will display a low-resolution satellite image under the resulting map. Selecting Vector returns the map to the normal view.
- Save Results As: Before making a map, checking this box will provide a zipped file for download that contains
Shape (shp) files, Design (DGN) files or Google Earth (KML) files.
Road Inventory Query Example: Map and Report
This example shows how to use Road Inventory data to examine Median Widths around the Wailuku area,
in both Map & Report form:
- Select Island/Maui from the banner Control Panel to display a map of Maui
- Select Queries/Road Inventory
- Draw a box around the Wailuku area with the Zoom by Area tool to create a map like the one shown
below
- Under Category, select Median Widths
- Use the Spatial Filter default: Current View
- Ref Year: 2008 (date the data was collected)
- Select Make Map & Build Report (waving palm trees are visible while the new map and report are being
generated): the Map reappears as follows.
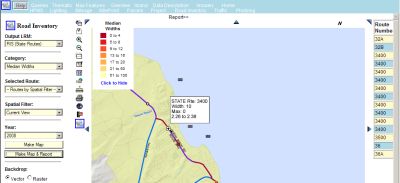
Two new visuals are visible in the map:
- In the upper left corner of the map is the color coded feature Legend: if it is not visible click
the word "Legend" at the top left of the map; to collapse it click the blue line at the bottom of the
Legend "Click to Hide". The Legend defines the color coding as it appears on the map.
- To the right of the legend name is the link to the Report, shown as "Report>>".
Click on Report>> to see the Report: a small view of the map remains on the left while the scrollable details of the report appear on the right.
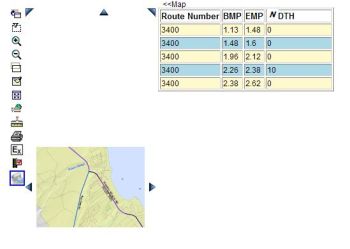
Above the Report, on the left side, is the link <<Map, enabling a return to the full-sized map.
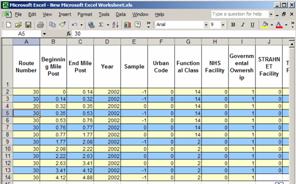
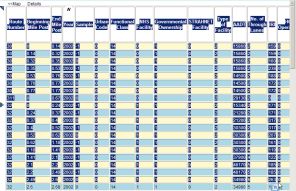
Outputting Reports
Reports can be copied and saved into any Microsoft-compatible desktop office product. The following
view shows a more complex report than the one created in this example but it would work the same on this
example report. All of the standard manipulations may be performed on the report (sorting, totals,
saved, printed, etc.). The following views show the Report with cells highlighted for copy (right-click
and copy), and a Microsoft Excel data sheet into which the cells have been pasted (right-click & paste).
Report:
Excel data sheet: